The Most Dangerous Term Financial Advisors Are Still Using Today!
Nov 17, 2020
….. And it's leading people down a dangerous path in retirement
I want to talk about a dangerous term that financial advisors are still using today. It’s a term that they’re using when they’re helping retired clients and those that are approaching retirement. And this term can be extremely misleading and dangerous.
So, if you or somebody you know is in, or approaching retirement, this is a must read because it could be the difference between success or financial failure very early in your retirement.
The Big Picture
Most financial advisors are adept at designing investment portfolios for the accumulation or growth of your assets. But in my experience, very few have the required understanding and expertise to design investment strategies that will turn your assets into a long-term reliable source of income that will last throughout your retirement years. These require two completely different skillsets.
Proper retirement income planning is crucial. You’ve worked hard to reach your golden years and hopefully you have built up a commendable amount of savings you plan on using to support your daily living needs. Now you want to turn that nest egg into an income stream that will last your entire retirement life. You no longer have a salary so making this money last is crucial. There’s no “do-over” here and it’s highly likely you don’t want to go back to work. So meticulous retirement income planning with an expert is essential, otherwise things can go bad very quickly.
 The Bottom Line
I’ve spent a considerable amount of my time traveling the country training other financial advisors and it still amazes me that many are still using the term Average Rates of Return when describing and designing investment portfolios for their client’s retirement income needs.
If you have a financial advisor and you hear this term when discussing your retirement portfolio, you need to walk out immediately. And you need to find a new financial advisor as soon as possible because that advisor does not have a clue on what they’re doing. It is imperative you find somebody who understands retirement income planning and specializes in this area.
So What’s the Fuss?
Average Rates of Return simply means what it says…the average of your annual returns over time. For our example, let’s call it 6%. What this means is that hypothetically, one year you earn a twelve percent rate of return, and the next you’re down two percent, and the next you’re up eleven percent and the next year you’re up three percent, and so forth. When you average those returns, it comes to 6%.
Here's the big problem…Average Rates of Return means nothing when you’re drawing money out of your portfolio. If you were to take the above returns mentioned earlier, and reverse the order, you would have an entirely different outcome. But the average would be the same.
Before I get into the analysis let me start with little levity. As funny as this is, this cartoon is precisely why proper retirement planning is so important – and doing so at a young age!

The Heart of the Analysis
Okay, take a look at the chart below. I know this looks extremely confusing, but I’m going to walk you through it, so you can understand it. You may even want to print this out as a reference so you don’t have to scroll up and down as I walk you through it.
See my blog: For the Millions of Us Living in Financial Pain…How Did We Get Here

Here’s an example of two portfolios: Portfolio A and Portfolio B. At the top, you will see In both cases, both portfolios started with $500,000 to invest. That’s how much money they accumulated prior to the retirement. The goal was to withdraw $25,000 per year to cover their spending needs. And we’re going to adjust that amount every year by 3% to cover inflation. You with me?
$500,000 to start. $25,000 annual withdrawal. 3% increase for inflation.
On the far left, you will see that both individuals retire at age 65, and this example goes all the way to age 100. The next column titled “Returns” shows the annual returns grouped in 7-year sequences. And what you’ll notice is the returns are the same every seven years: -23%, -6.1%, -.03%, +24.5%, +18%, +19.6%, +22.7%. Followed by the same pattern in the following seven years and so forth.
In the interest of space on this chart, age 73 to 79, and age 87 to 93 are not shown, but those time periods had the exact same returns as the time periods that are shown. Again, there just wasn’t the room on this chart to show them. But those returns are factored into this analysis.
The third column titled “Withdrawal” shows the amount they are withdrawing each year starting at $25,000 in the first year and rising by 3% each year thereafter to account for inflation. The fourth column titled “ACC Value” is the Accumulated Valued of the portfolio. This shows the change in the total portfolio value given market performance and the amount of money being withdrawn.
In this case, Investor A started off with three consecutive years of negative returns, followed by four very positive returns.
You can also see the amounts they are withdrawing over time.
Now, look at the ACC Value or the Accumulated Value in column 4. In the first few years, portfolio value took a big hit because of those initial negative returns. By age 70, the portfolio started to slowly climb back up as it experienced positive returns. You will notice though, it never got back to the initial amount of $500,000. This investor was under water starting in year one and never recovered.
Take a look at what happened, when this investor turned 85. That’s right, it ran out of money. Investor A was broke. Nothing left over to live on, other than perhaps a social security check to cover a fraction of their living expenses.
A tragic outcome, despite four very strong years of returns. Once they started off with a few negative returns, they were never able to recover and get back on track regardless of those following returns.
Now, I want you to look at the bottom of column 2 under “Returns”. Notice the average rate of return for this investor was 6.5% annually. Please hold that number tight in the back of your mind. 6.5% annually.
The Switch
Now, let’s switch over to Investor B. Unlike Investor A, Investor B starts out strong, with four consecutive returns of positive returns…up 22.7%, up 19.6%, up 18% and then up 24.5%. Following that strong start, they were then faced with three down years…down .3%, down 6.1%, and down 23.1%.
In the “Withdrawal” column, they are pulling out the exact same amount of money as Investor A.
Now, take a look at the ACC Value in the far-right column and look what that did over time.
Again, we started with $500,000. But we immediately see a rise in account value: $582,000 then $666,000 then $755,000 and finally $906,000. After this great run, we then start to see a slow decline due to the following three negative returns.
As we keep going, year after year, until Investor B reaches 100 years old, that portfolio ends up with over $893,000!
The Summary
If you look at the bottom numbers for comparison sake:
Investor A
The total income generated during retirement: $654,451
Available assets at age 85: $0
Investor B
The total income generated until age 100: $1,511,552
Available assets at age 100: $893,562
Difference in Withdrawals: $857,101
Difference in End Value: $893,562
Total Difference: $1,750,663
 The Big Takeaway
And here’s the big takeaway…take a look at Investor B and scroll down to the bottom of the “Return” column. What do you see? Yes, the Average Rate of Return for Investor B was, you guessed it, 6.5%! The same Average Rate of Return as Investor A.
Same return, yet a massively different outcome.
I think you’re getting the picture now. Average Rates of Return when describing an investment portfolio in retirement is meaningless and frankly, dangerous.
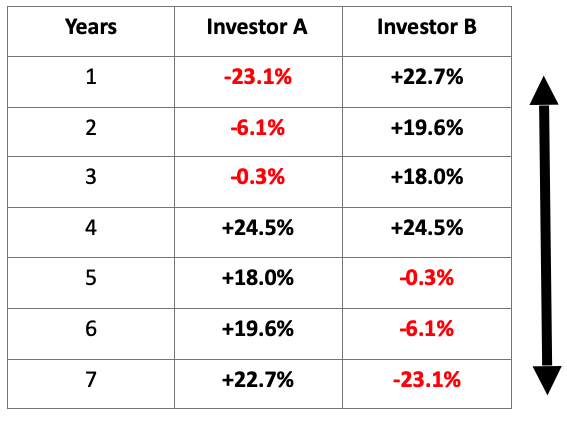
Now, if you look at returns for both Investors, you may notice a pattern. These returns are the exact same, accept in reverse order.
Take a moment and examine the returns for each investor and the order in which they come.
 The Key to Successful Retirement Income
As you may now gather, the key to a successful retirement income strategy is the “Sequence of Returns” not the Average Rate of Return. What that means is, your success or failure during your retirement is based on when those returns occur.
As I mentioned earlier, if you start off with negative returns in the beginning it can be difficult if not impossible to recover despite the fact that you have several following years of very positive returns. In essence, you are really starting in a hole with a shovel, not a ladder.
This is why designing an appropriate and effective investment portfolio that is not susceptible to major declines, especially in the beginning, is so vitally important to your long-term success.
This is also why it is so important that you’re working with a financial advisor who specializes in retirement income planning.
I want to hammer this home with another chart. Here, you can see that Portfolio A runs out of money at age 83 while Portfolio B in red has ample assets at age 90. Just like the other returns we looked at, the rates of return are the same, just in reverse order. And again, the exact same Average Rate or Return, but vastly different “Sequence” of those returns. As a result, a huge disparity in outcomes. Portfolio B started off so strong while Portfolio A started with negative returns, that was the key between success and failure.

I hope that was informative and really opened your eyes to what potentially could be a huge time bomb in your retirement plan.
Please forward this on to anyone you know who may be facing retirement or in it right now. It could make a huge difference!
Also, when talking with a financial advisor, dig deep on their retirement income planning experience. I have a white paper you can download called, “The Ultimate Guide to Selecting a Financial Advisor”
In it, I get into specifics on what to ask and what to look for in finding the right advisor who understands this important area.
 My Offer to You
Lastly, I want to offer you an opportunity to discover once and for all how close you actually are to live the life you deserve to live – the life you have always envisioned for yourself and for your family.
The ThrivePath Assessment was specifically designed for you to determine where in fact you are on your path to financial freedom and peace of mind. This assessment that can and will be one of the most important steps you take in your journey to financial freedom.
The ThrivePath assessment has been specifically designed to determine “the why” and “where” you are on your path to financial freedom and peace of mind. Without a starting point, it is very hard to move forward and achieve your goals and desires.
Take 10 Minutes and Click Here to Complete this FREE Assessment
And remember it's never too late to start your journey to financial freedom and Peace of Mind
Your financial destiny is not a matter of chance it's a matter of choice and it's something to go after not wait for.
I’m John MacGregor, Founder of ThrivePath: The Revolutionary Solution to Your Financial Freedom and Peace of Mind.
Here’s to your financial success and overall happiness. Upward and Onward!